Introduction
────────────────────
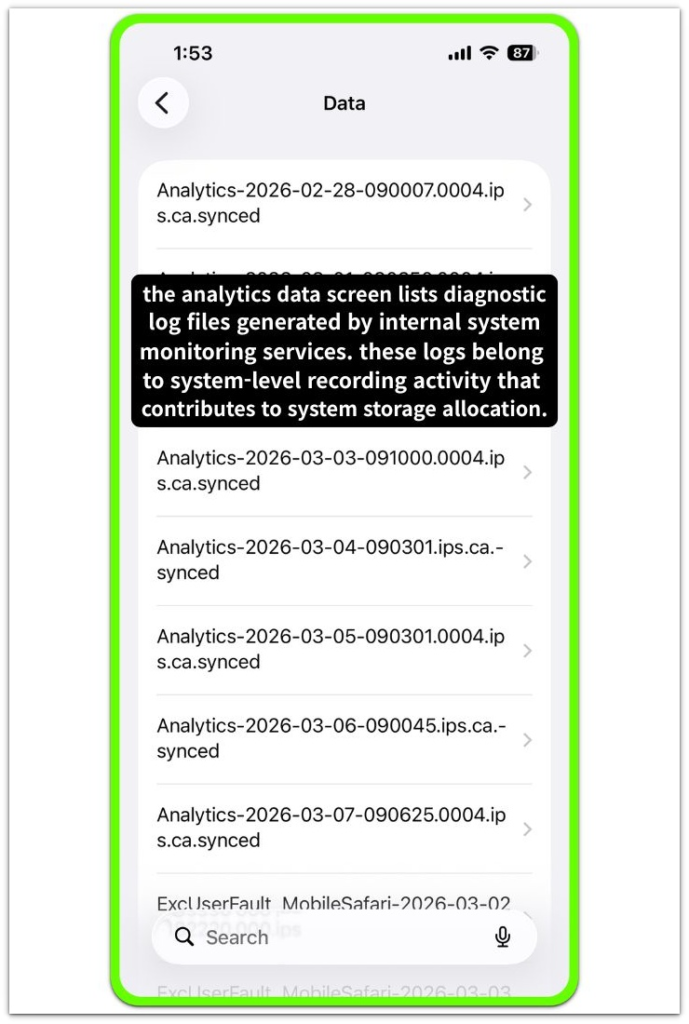
iphone logs taking up storage describes a condition where hidden diagnostic log files continue accumulating inside the system layer, gradually occupying storage even though the user has not saved new visible data.
The storage bar can shrink over time while apps and photos remain unchanged.
Nothing unusual appears inside the app list.
Diagnostic logging operates continuously inside iOS.
When system services detect events, errors, or internal state changes, those services record log entries so the operating system can trace behavior during background analysis.
Most of these logs are temporary and are normally rotated or removed automatically.
Storage pressure begins when log rotation does not clear older entries quickly enough or when diagnostic activity increases after updates, crashes, or indexing events.
From the user perspective, the visible storage interface only shows the final allocation result.
The background diagnostic layer that writes log files operates beneath that interface.
Storage decreases while visible user data remains unchanged because diagnostic logs continue accumulating inside the system layer.
────────────────────
Step-by-Step Guide
────────────────────
────────────────────
Step 1: Verify the storage category where the increase appears
────────────────────
Open Settings → General → iPhone Storage.
Observe the storage bar and review the categories listed below it.
Check whether the increase appears inside system data rather than inside applications, photos, or media.

If iphone logs taking up storage is occurring, the visible user categories often remain stable while the system allocation segment grows.
This observation helps confirm that the storage expansion originates from background system activity rather than new user files.
────────────────────
Step 2: Check whether the storage increase appeared without new user activity
────────────────────
Review recent device activity.
Confirm that no large applications, videos, or downloads were added recently.
Compare the current storage amount with what was visible earlier.
When diagnostic logging expands, the available space changes even though the visible data structure remains nearly identical.
This pattern separates background log accumulation from normal user storage usage.
────────────────────
Step 3: Observe whether the system data area fluctuates after normal system events
────────────────────
Return to the iPhone Storage screen and monitor the system data segment.
Storage allocated to system processes can change after events such as device restart, update initialization, or system indexing activity.
If iphone logs taking up storage is related to diagnostic logging, the system allocation may temporarily expand while background services record operational events.
The storage interface reflects the allocation change while the logging process itself remains inside the system diagnostic layer.
If you need further details about how iOS manages system storage categories, you can review the official Apple support documentation below.
────────────────────
Troubleshooting: iphone logs taking up storage
────────────────────
────────────────────
Troubleshooting 1: System Data Continues Increasing Without New Files
────────────────────
If the storage bar keeps decreasing while apps, photos, and videos remain unchanged, the change usually belongs to system allocation rather than new user data.
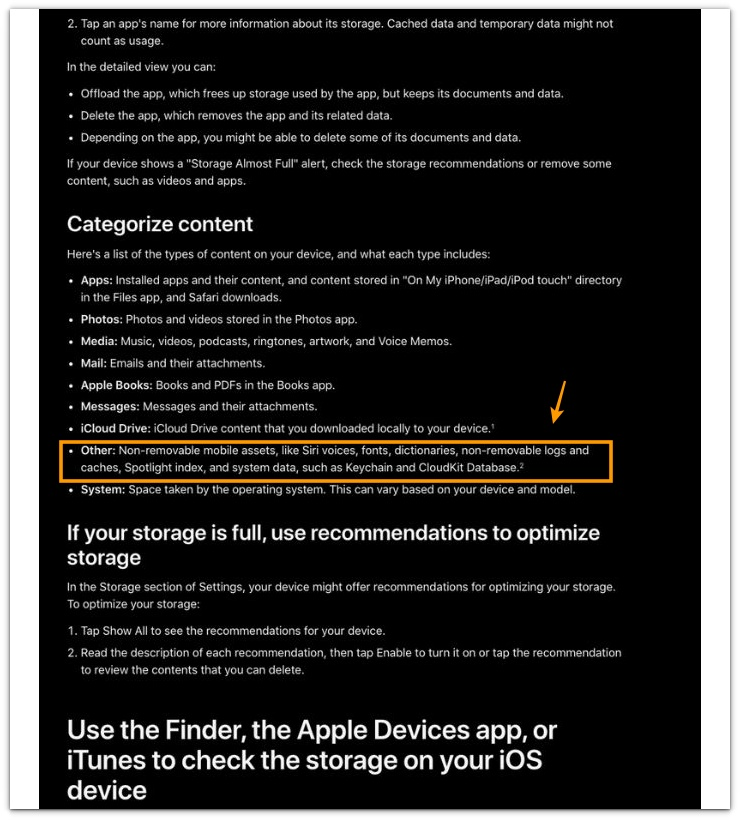
When iphone logs taking up storage appears in the storage bar, the storage interface groups several internal components into the system data category.
This area can contain temporary caches, diagnostic logs, and background monitoring records created during normal device operation.
When system services generate diagnostic information, those records remain inside protected system directories.
The storage screen reflects the combined allocation of those internal components even though the individual files are not visible in the app list.
This condition indicates that the storage change originates from background diagnostic activity rather than user-generated files.
────────────────────
Troubleshooting 2: System Data Size Changes After Restart
────────────────────
Restart the device once and return to Settings → General → iPhone Storage.
During startup, iOS rebuilds several internal indexes and reconciles allocation records for temporary system components.
Diagnostic logs, temporary system files, and cached service artifacts may be recalculated during this process.
Because the storage interface shows the final allocation state rather than the individual records, the size of the system data section can change after the device finishes startup.
This adjustment reflects internal storage accounting rather than new file creation.
────────────────────
Troubleshooting 3: Storage Value Stabilizes After System Processes Finish
────────────────────
Observe the storage value for a short period after the device finishes normal background activity.
System monitoring services periodically generate diagnostic logs while the device operates.
Those records can temporarily expand storage allocation inside the system layer.
Once the diagnostic cycle slows and older log entries rotate out of the storage pool, the reported storage level usually stabilizes.
After internal background recording activity finishes, the storage interface reflects the updated allocation.
If the storage value continues changing for an extended period, the issue may relate to deeper system processes that cannot be inspected directly from the storage interface.
────────────────────
Additional Tips
────────────────────
iphone logs taking up storage usually originates from diagnostic logging generated by background system monitoring inside iOS.
Logs can be created when the operating system records crash traces, performance metrics, or background service events.
These records are stored inside protected system directories and are not exposed through the normal storage interface.
Because of this design, the storage screen shows the total allocation result rather than the individual diagnostic files responsible for the change.
Temporary storage expansion can appear even though the visible data on the device has not changed.
────────────────────
Final Notes
────────────────────
When iphone logs taking up storage appears, the storage change usually reflects diagnostic records created by background system monitoring services.
The storage interface only displays the final allocation totals.
Diagnostic logging and internal system monitoring operate beneath that visible storage boundary.
The reported storage change represents internal system activity rather than visible file growth.
This behavior marks the boundary between user-managed storage and background diagnostic allocation.
────────────────────
Checklist
────────────────────
☐ Confirm that the storage increase appears inside system data rather than inside apps or media.
☐ Verify that no new large files were added before the storage change appeared.
☐ Restart the device and observe whether the system data amount changes afterward.
☐ Check whether recent updates or repeated application crashes occurred.
☐ Observe whether the storage value stabilizes after background system activity finishes.
On a real device, this situation often feels confusing because storage decreases even though nothing new appears in the places the user can directly inspect.
────────────────────
Extra Section 1
────────────────────
Storage changes caused by diagnostic logs rarely appear suddenly during normal device operation.
For example, after a system update or after installing a new application that triggers background services, the device may begin recording more diagnostic activity than usual.
Crash traces, service performance logs, and monitoring records can accumulate while the system observes how the device behaves under the new configuration.
During that period, the storage bar inside Settings → General → iPhone Storage may slowly decrease even though the visible app sizes remain stable.
Users often notice this pattern when checking storage repeatedly and realizing that available space continues shrinking while nothing new appears inside Photos, Apps, or Media.
Across multiple devices, this pattern is especially common shortly after major iOS updates.
The system performs extended monitoring and logging during the first days of operation, and the storage interface reflects the resulting diagnostic records.
Once the monitoring activity slows and older diagnostic entries rotate out of the internal storage pool, the reported storage amount usually stabilizes.
The important point is that the visible storage categories do not expose those internal records.
The interface only displays the final allocation result produced by background diagnostic logging.
────────────────────
Extra Section 2
────────────────────
Another pattern frequently observed on real devices appears after repeated application crashes or unstable background services.
When an app repeatedly terminates unexpectedly, the operating system records crash diagnostics and service traces so the system can analyze the event later.
These diagnostic entries can accumulate for a period of time inside system storage.
In those situations, users often notice that the system data section becomes larger while the app itself does not grow in size.
The storage screen shows the allocation result, but the diagnostic files responsible for the change remain hidden inside protected directories.
iphone logs taking up storage often appears during these diagnostic recording cycles.
The storage interface reflects the internal logging activity rather than the growth of visible files.
On devices used heavily for testing, development, or frequent app installations, this pattern appears more often because the operating system generates additional monitoring records when new services interact with the system framework.
After the diagnostic cycle completes and older log entries rotate out of the system storage pool, the storage allocation usually returns to a more stable level.
This behavior demonstrates how the storage interface reports the outcome of internal diagnostic processes rather than exposing the underlying log files directly.